Greta Lange · 26 September 2026
Regional Growth Patterns Emerge as Boldfeld Balances Development and Preservation Efforts
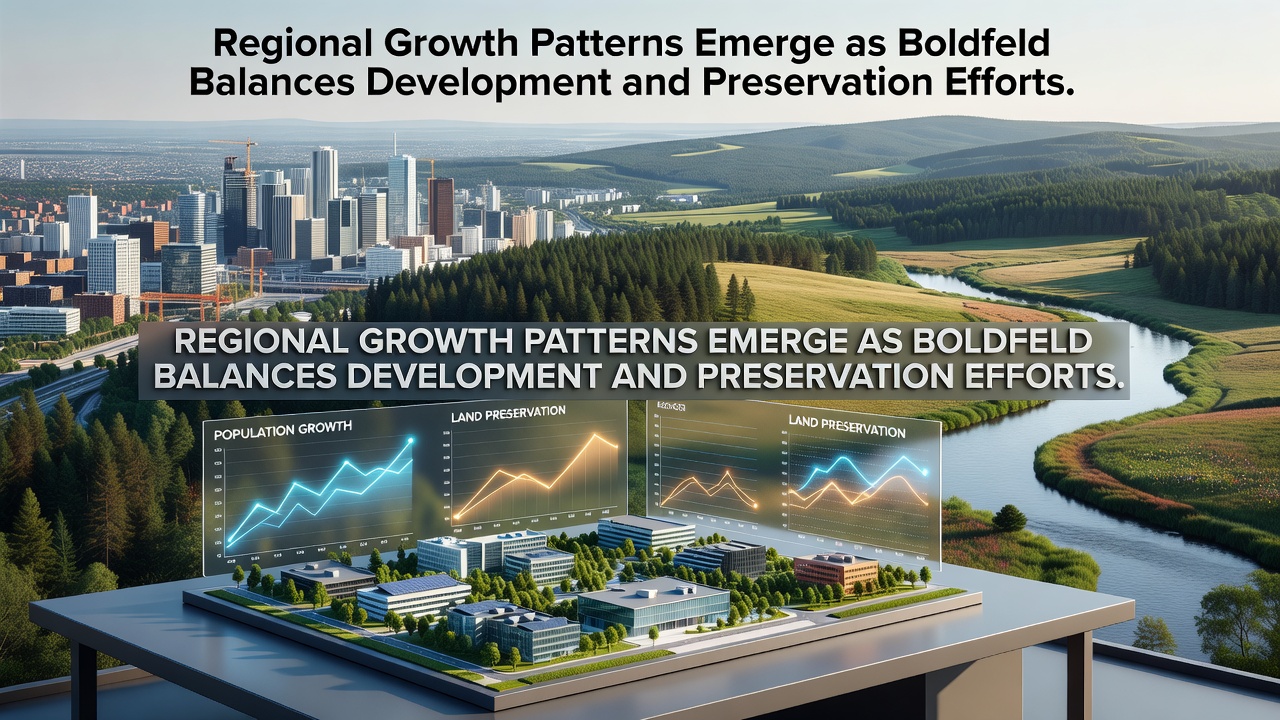
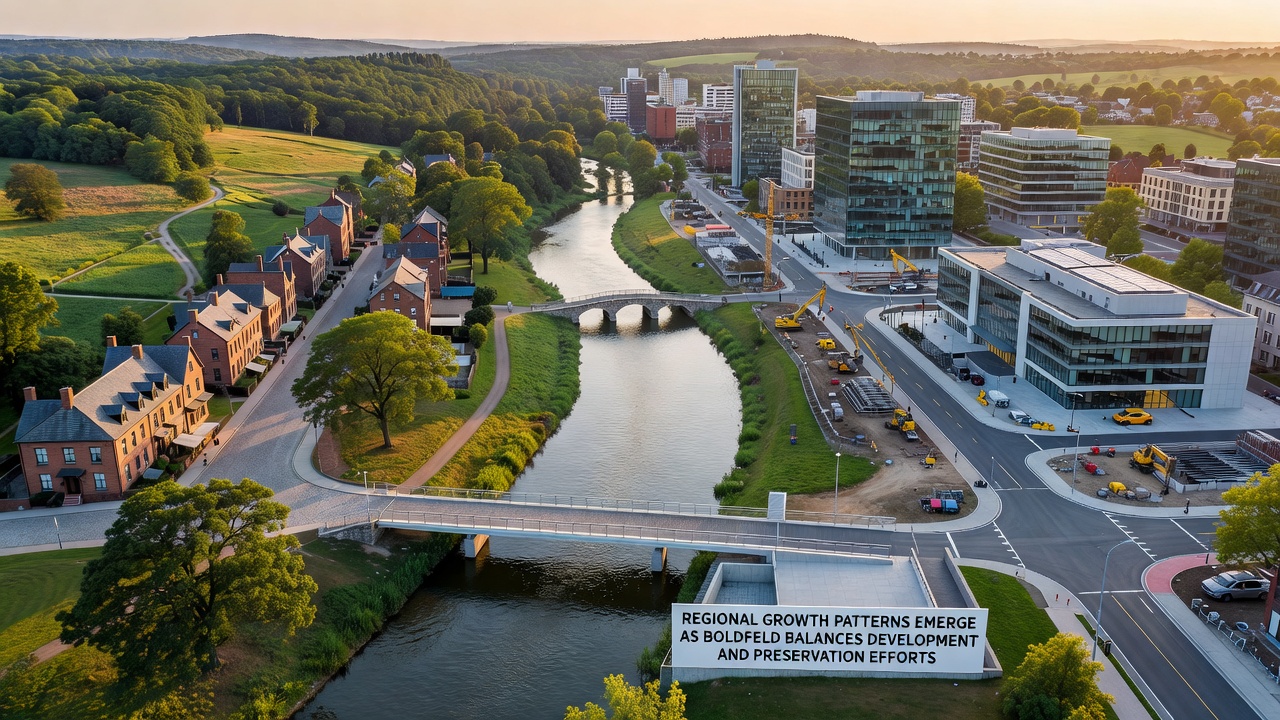
Regional growth patterns in Boldfeld have taken shape through coordinated planning that pairs new infrastructure with designated conservation areas, and data collected through 2026 indicates steady expansion in residential and commercial sectors while core natural zones remain intact. Authorities track these trends via annual land-use reports that map residential clusters, transport corridors, and agricultural reserves side by side. In September 2026 the regional planning office published revised boundary maps that formalize additional buffer zones around wetlands and woodlands, and these updates coincide with construction permits issued for mixed-use districts on the eastern and southern edges of the municipality.
Land Use Data and Expansion Trends
Statistics released by the Boldfeld Regional Authority show that developed land increased by 4.8 percent between 2023 and 2026, while protected open space grew by 3.2 percent over the same interval. Researchers at the University of Freiburg compiled satellite imagery that confirms the dual trend, and their analysis links new housing starts to existing transport nodes rather than scattered greenfield sites. Employment figures from the same period indicate that 2,150 new positions appeared in logistics and light manufacturing districts, whereas tourism and recreation enterprises operating inside preservation zones reported stable visitor numbers without measurable habitat loss.
Policy Framework Guiding the Balance
Local ordinances require that any new commercial project exceeding two hectares must set aside an equivalent area for ecological restoration or public green space. Compliance data gathered through 2026 reveals that 87 percent of approved developments met this threshold through on-site measures, while the remainder contributed to a regional offset fund administered by the state environmental ministry. Planners integrate these requirements into master plans that designate priority growth corridors along rail lines and arterial roads, and they simultaneously classify steep slopes, riparian buffers, and remnant forests as no-build zones.
Transport investments illustrate the same coordinated approach. The extension of the regional tram line completed in early 2026 serves three new residential neighborhoods yet terminates before reaching a protected valley floor, and ridership data from the first six months of operation shows daily averages of 4,800 passengers with corresponding reductions in private vehicle kilometers traveled on parallel roads.
Comparative Examples from Other Regions
Similar patterns appear in other European jurisdictions that publish comparable metrics. According to the European Environment Agency, several mid-sized cities have recorded parallel increases in both built-up area adn protected habitat when strict offset rules accompany zoning decisions. In Canada, Statistics Canada land-cover accounts for the period 2020-2025 document equivalent outcomes in mid-sized municipalities that adopted growth boundary policies, and those datasets show no net loss of wetland area despite population gains of 6 to 9 percent. Observers note that these outcomes depend on consistent enforcement and transparent mapping rather than on any single regulatory tool.
Monitoring and Future Projections
Continuous monitoring relies on a network of fixed sensors and periodic aerial surveys that feed into an open data portal maintained by the regional authority. September 2026 updates incorporated refined elevation models that better delineate flood-prone zones, and planners used the revised layers to adjust the boundaries of two planned business parks. Projections derived from current permitting rates suggest that developed land could reach 12 percent of the total municipal area by 2030, provided offset requirements remain in force and no large-scale rezoning occurs outside designated corridors.
Conclusion
Regional growth patterns in Boldfeld continue to reflect deliberate pairing of development approvals with preservation commitments, and the September 2026 mapping exercise supplies the latest evidence that both objectives advance together when supported by measurable targets and regular data review. Further updates scheduled for 2027 will test whether the current trajectory holds under changing economic conditions.